With the powerful prediction graphs by Cycles-Trader, which provide both timing and direction for stocks and indices, for weeks and months ahead, there is the phenomenon of inverse which occurs rarely and randomly, but can still confuse the trader.
This phenomenon is when the graph indicates one direction and the price is moving in the opposite direction. Sometimes there is a warning sign ahead of the accordance in the form of a twist in the Blue line which makes it easier to identify in advance, However, sometimes this twist in the Blue line can indicate just a sideways. Sometimes the inverse can occur without a warning sign in advance.
Side note: In case of inverse, the timing is still intact and still relevant and provides a powerful advantage to the trader.
To solve this challenge of identifying the inverse, the proposed solution is to provide both the original direction and the inverse direction of the graphs, providing a powerful tool for the trader to track the direction and identifying the potential inverse on real time, and thus benefit from both directions in case of inverse.
This solution provides two advantages:
- Real time identification of the inverse occurrence and exit the trade if needed.
- Benefiting from the change of direction by trading the new direction, with the same timing.
Here are some cases with true inverse warning signs, some cases with false inverse warning signs and examples of identifying the inverse in real time by using both the original and the inverse graphs.
It seems that in all these cases the change of direction from original to inverse occurred in conjunction to the intersection of the straight and inverse graphs.
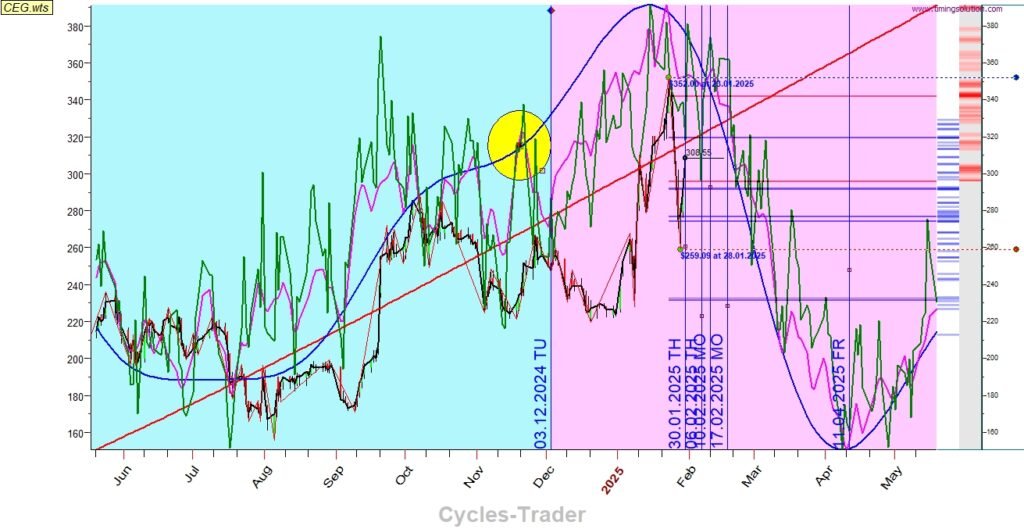
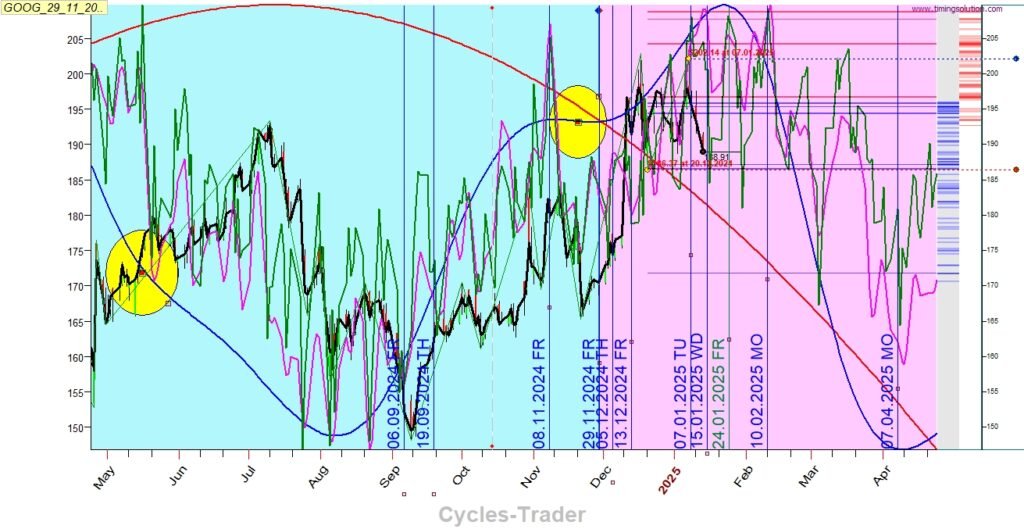
Cases of true inverse warning sign
Cases of false inverse warning sign
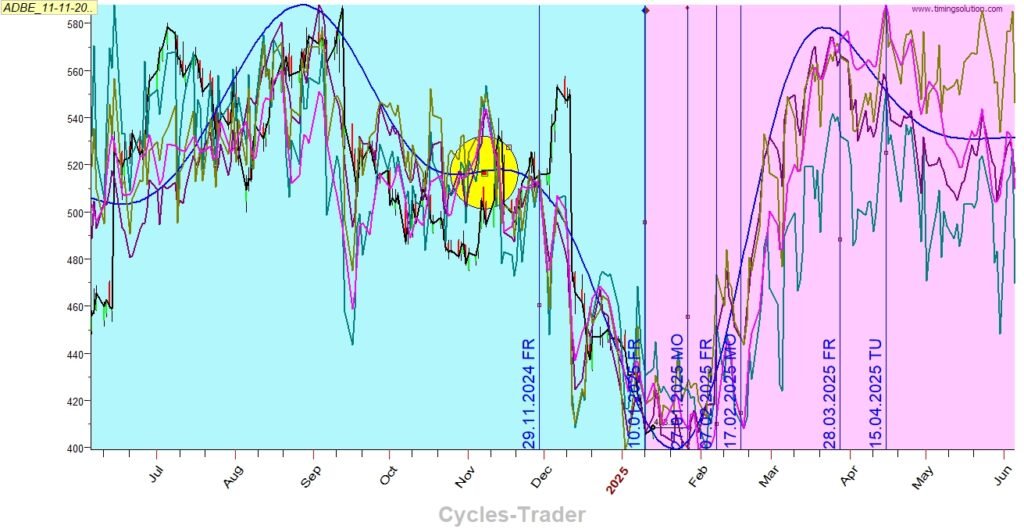
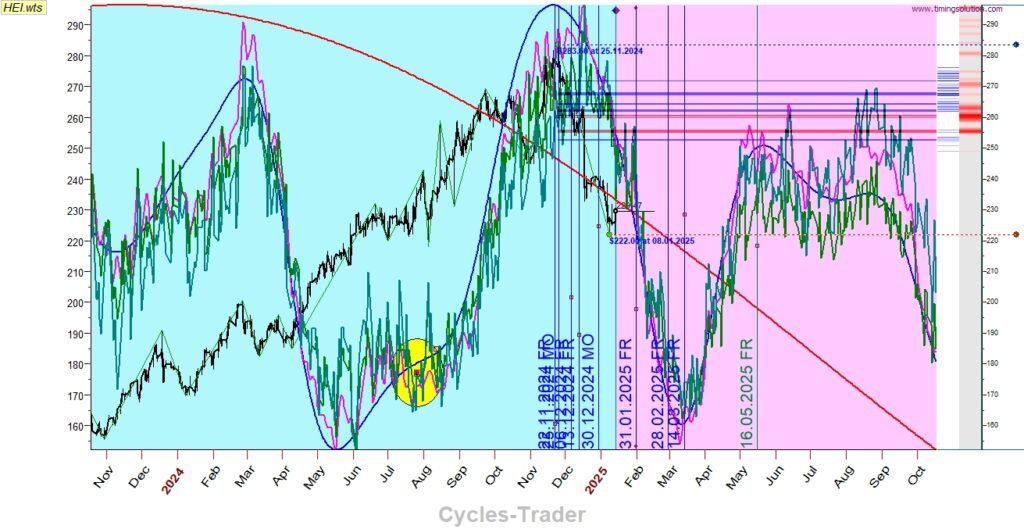
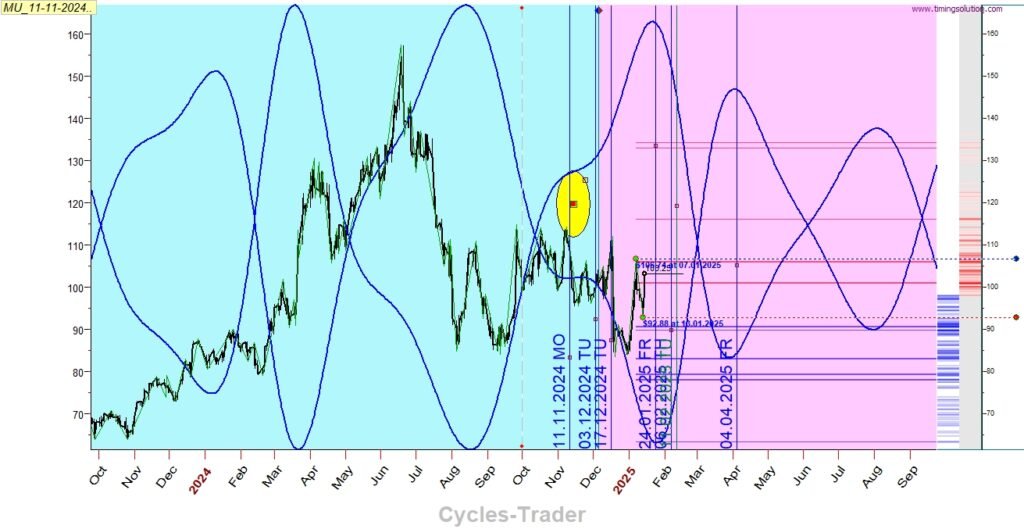
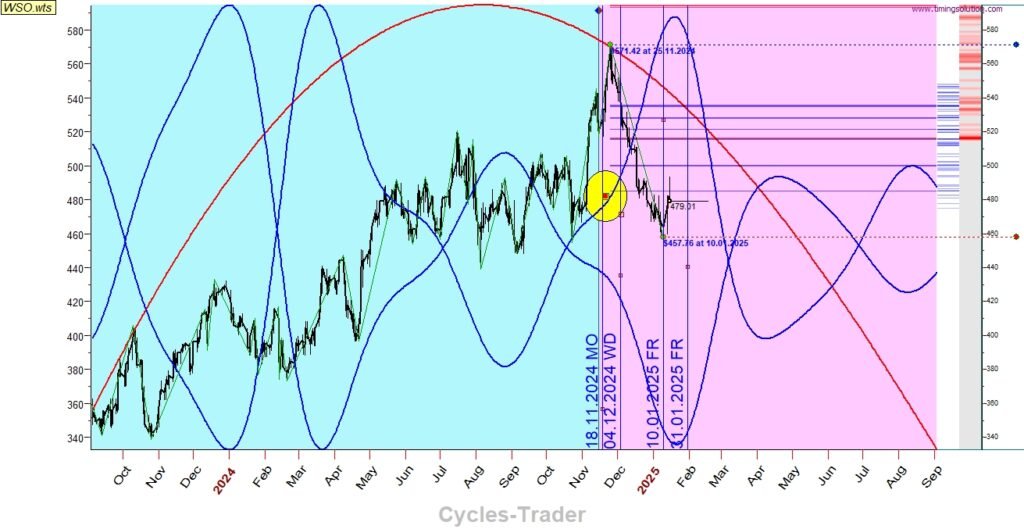
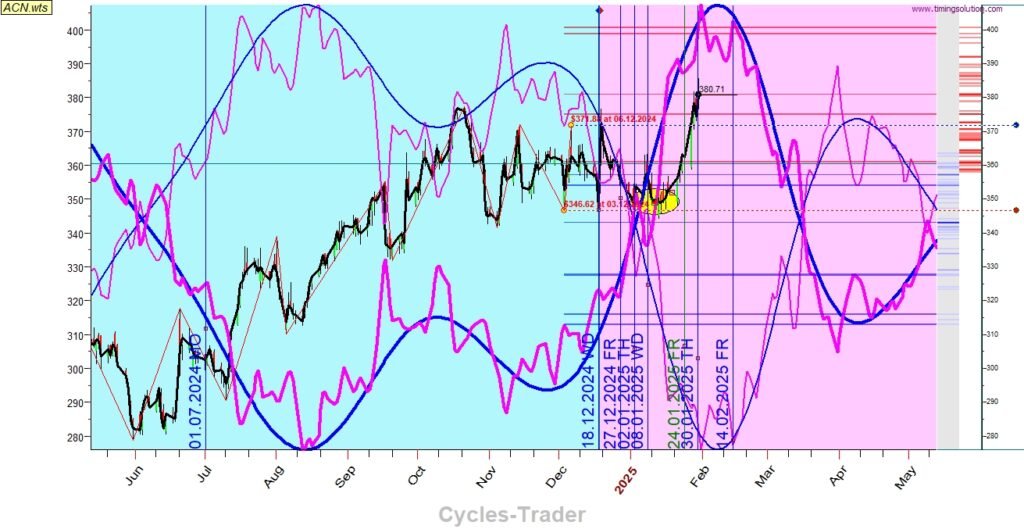
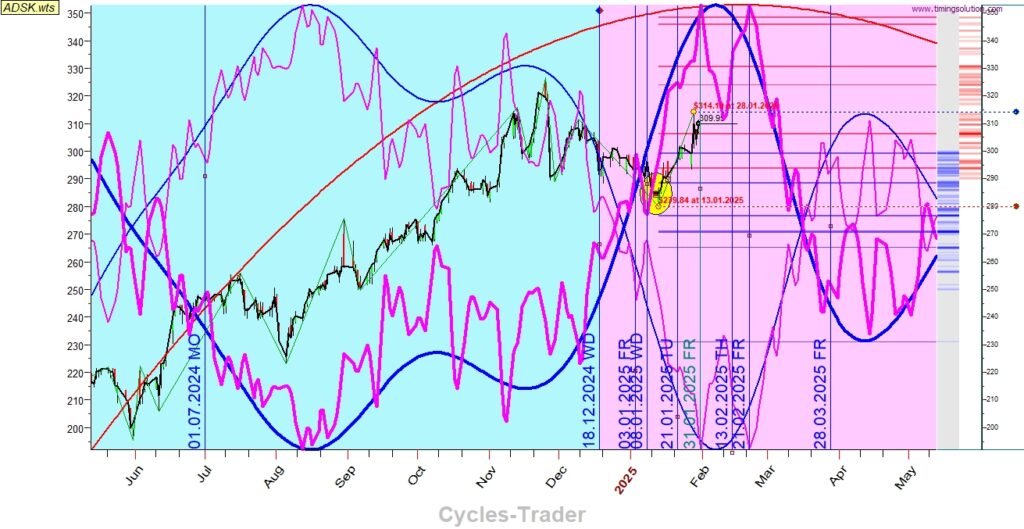
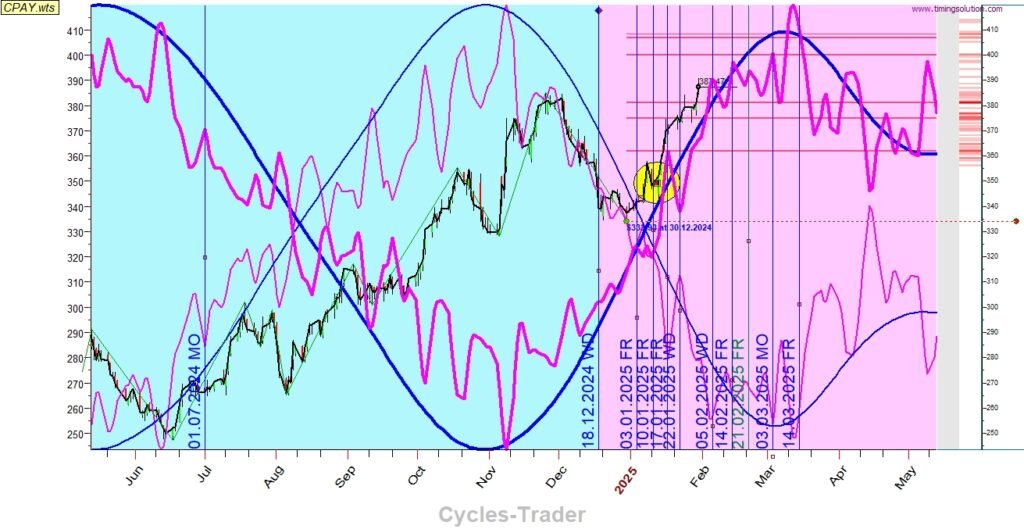
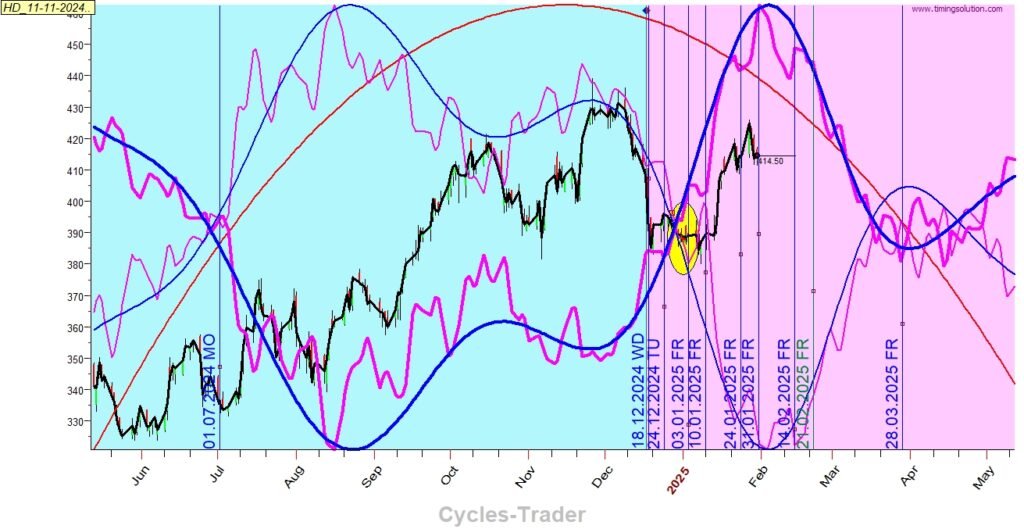
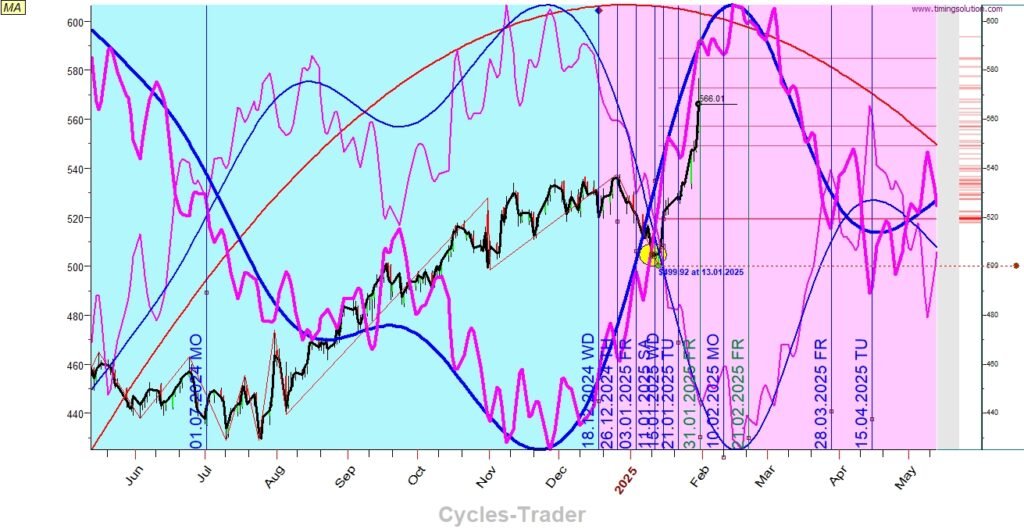
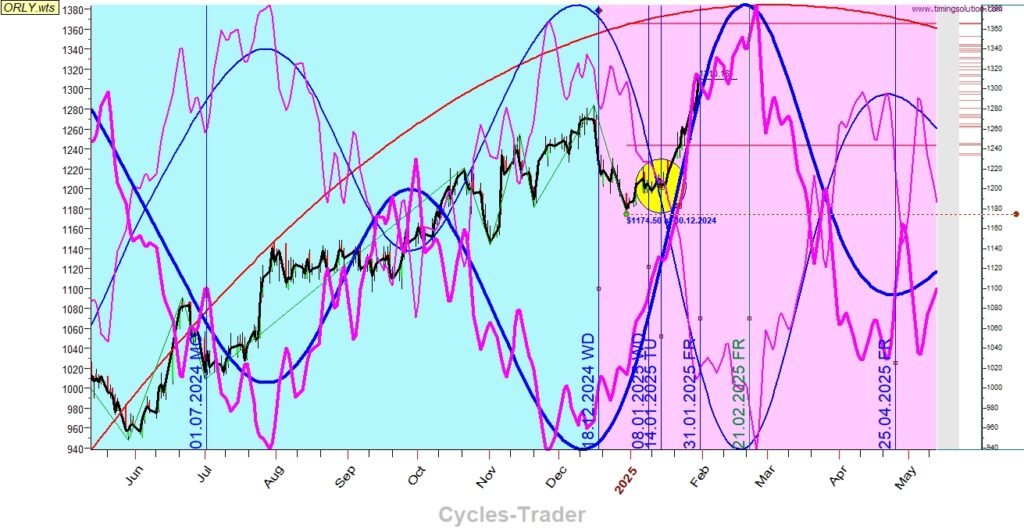
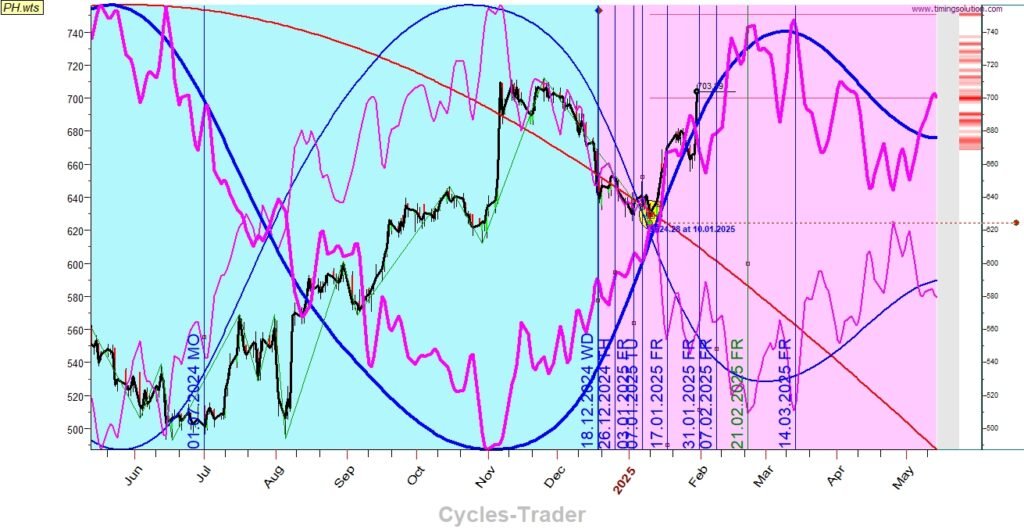
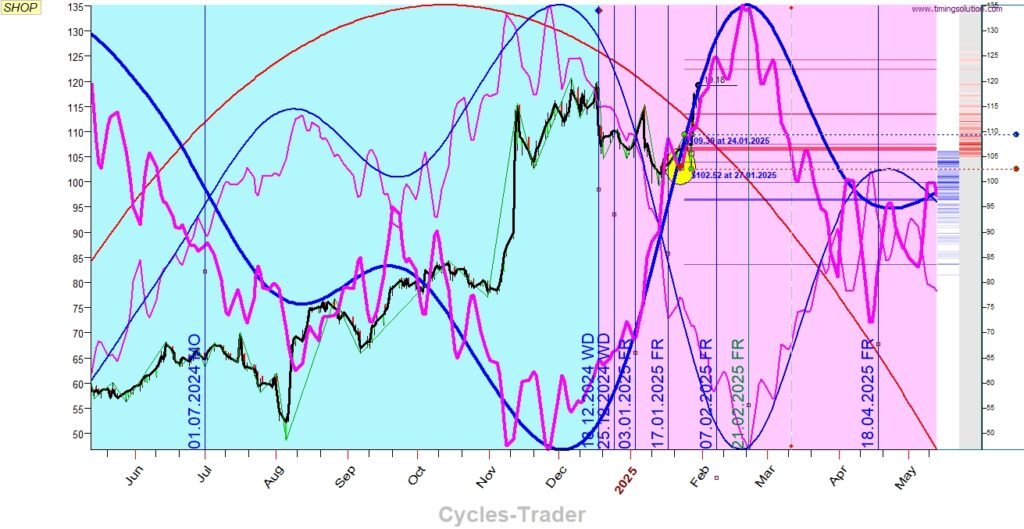
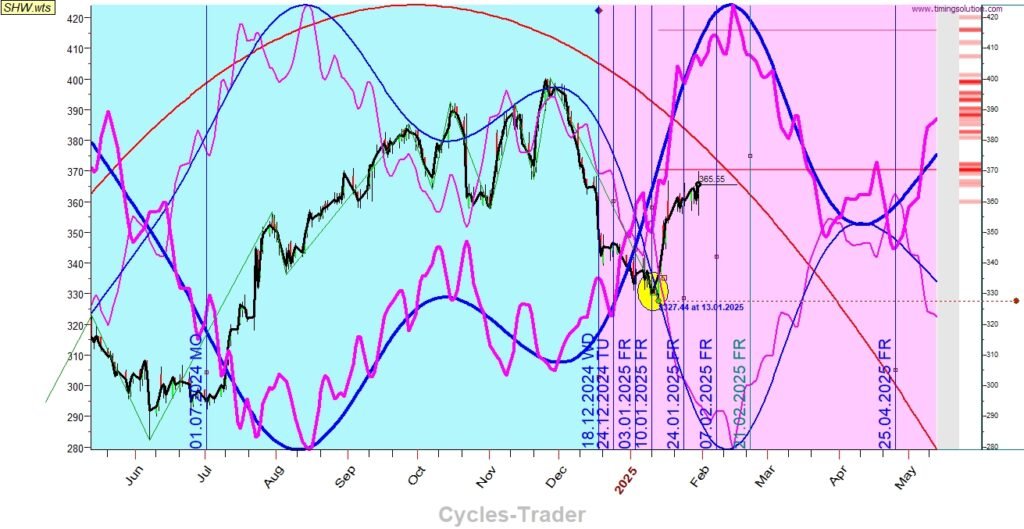
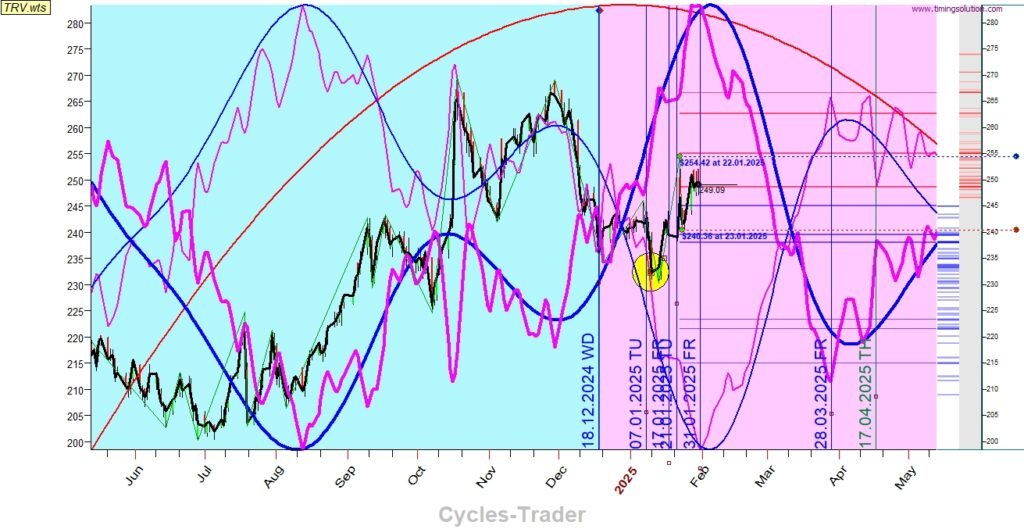
Examples of identifying inverse cases with the original and inverse graphs
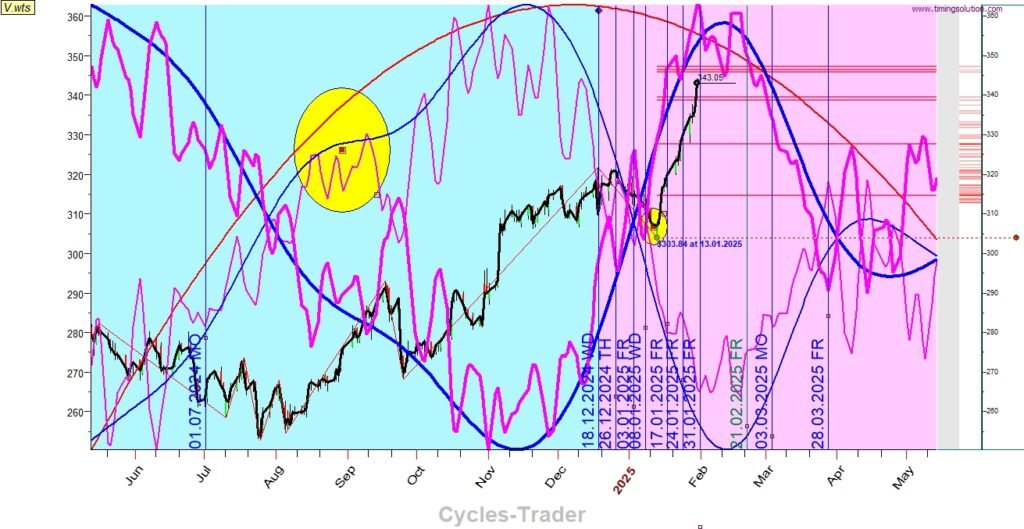
In the examples ahead, the thin lines are the original predictions, the thick lines are the inverse predictions.
As can be seen, the sudden change of direction of the price from the original prediction lines appear in closed conjunction with the intersection point of the original and inverse graphs. This insight will be further researched to check if this can be used as a general thumb rule.


AI cycle forecast tool
[…] Yellow circle – potential trigger for inverse (more on the inverse phenomenon please find here ) […]