Following intensive development and verification efforts, a new model J is born, which is more accurate in short term. Model J can also provide early signals for upcoming inverse, where model G is not firm on these early signals.
In this post we present a comparison of the existing model “G” vs the new model “J” for the first 4 months of 2025.
Compared stocks:
To be consistent with the presentation of performance for model U and model 120, the same 27 price instruments will used to compare the models, representing different sectors and different price levels: SPY, COIN, NEM, LMT, ENPH, CEG, AZN, AMD, VST, ZETA, ACN, ADSK, CPAY, EQIX, EXP, FFIV, HD, MA, ORLY, PH, TRV, V, ADBE, ETH-USD, NVDA, AAPL, NIFTY-50.
Conclusions:
Legend:
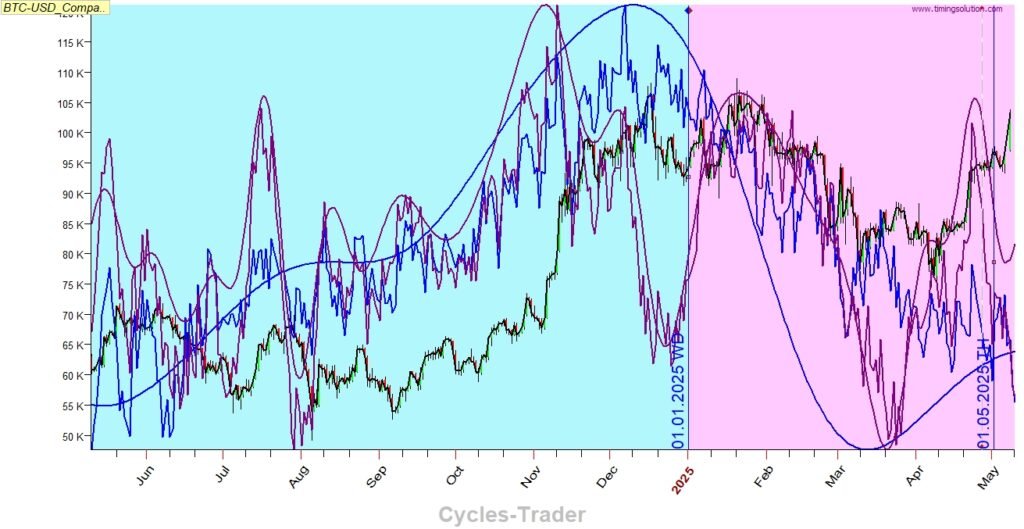
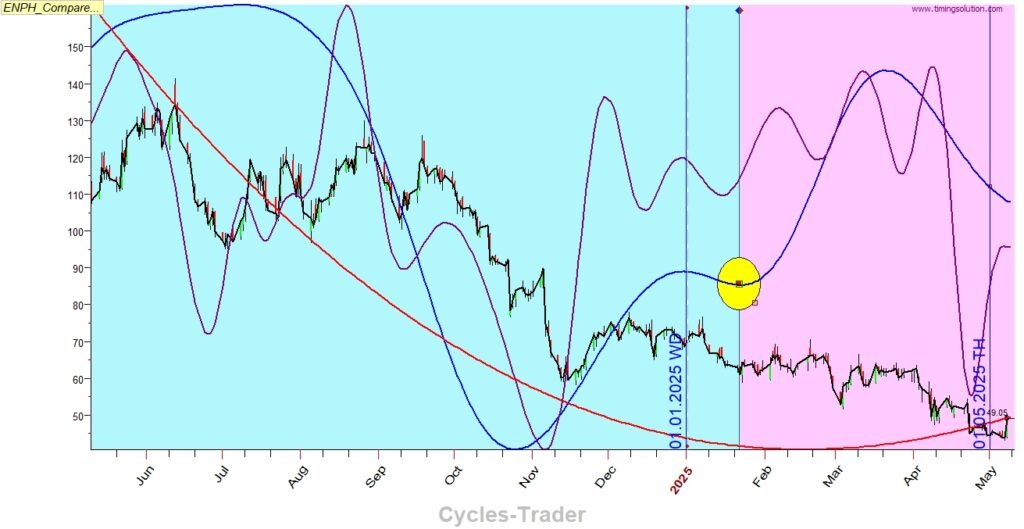
- Blue lines – Weekly (smooth) and Daily (choppy) predictions model G
- Velvet lines – Weekly (smooth) and Daily (choppy) predictions model J
- Yellow circle – potential trigger for inverse (more on the inverse phenomenon please find here )
Details:
SPY J weekly model are inverse

COIN Weekly G and weekly J

NEM

LMT J model Weekly and Daily are inverse

ENPH
CEG

AZN

AMD

VST

ZETA
ACN G and J models are inverse

ADSK G and J models are inverse

CPAY G and J models are inverse

EQIX G and J models are inverse

EXP J model is inverse

FFIV G and J models are inverse

HD G and J models are inverse

MA G and J models are inverse

ORLY

PH

TRV

V G and J models are inverse

ADBE
ETH-USD

NVDA Model J is inverse

AAPL G and J models are inverse

NIFTY-50
BTC-USD