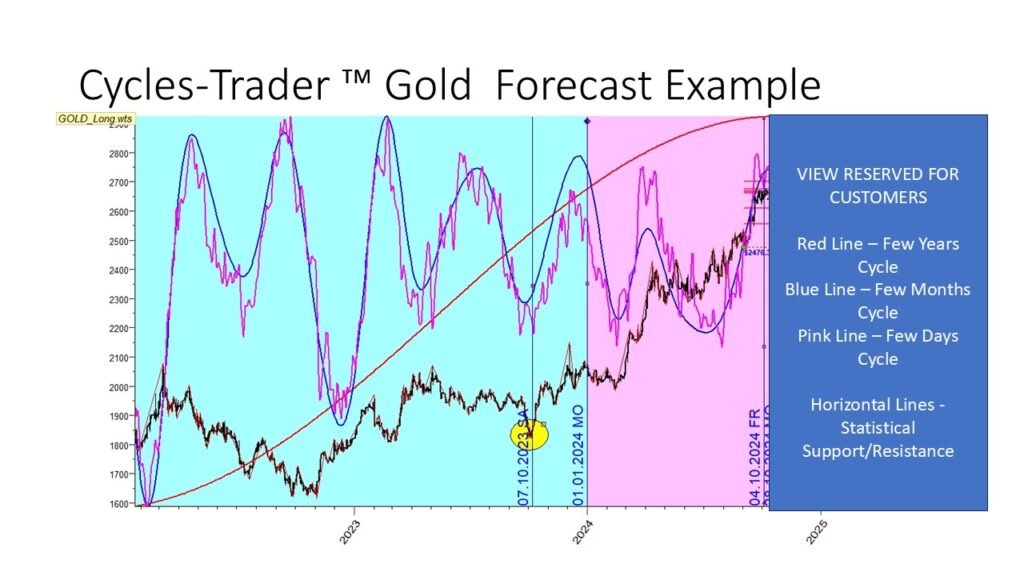
This is an example of how the forecast algorithms (AKA projection lines) performed on Gold for the first 9 months of 2024. Yellow circle indicates inversion point.
This is an example of how the forecast algorithms (AKA projection lines) performed on Gold for the first 9 months of 2024. Yellow circle indicates inversion point.