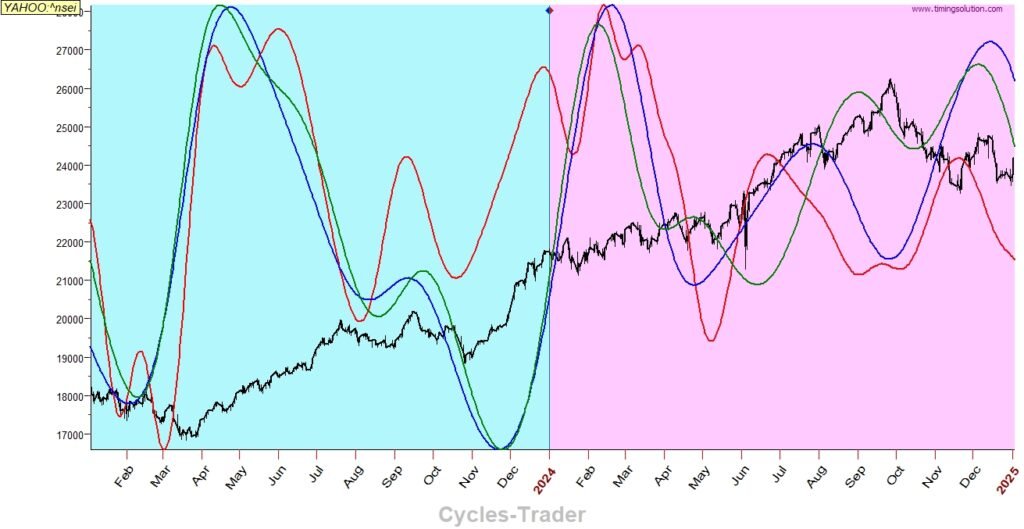
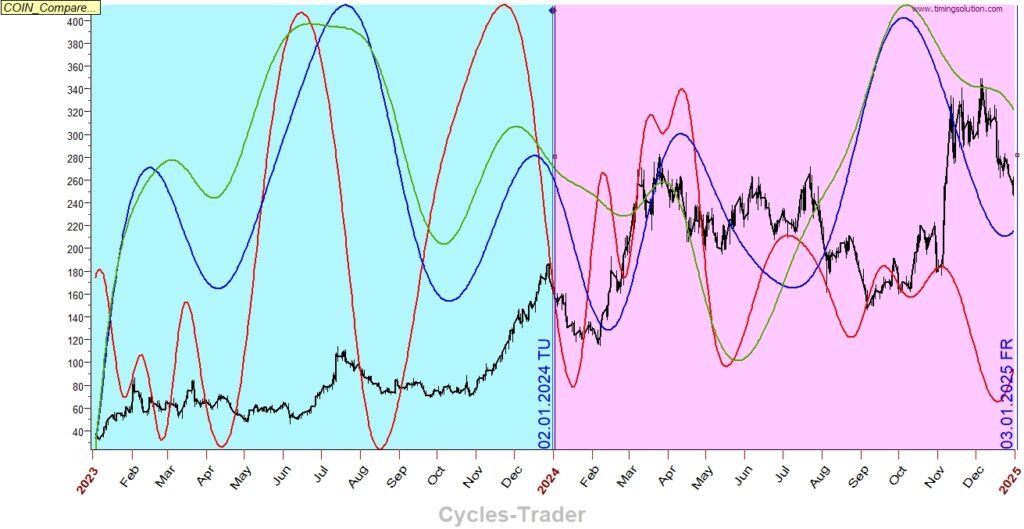
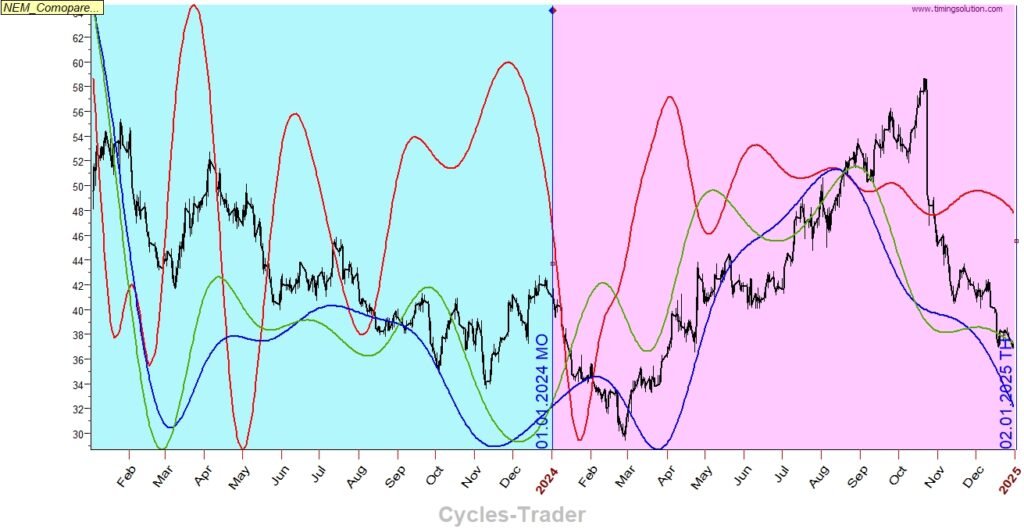
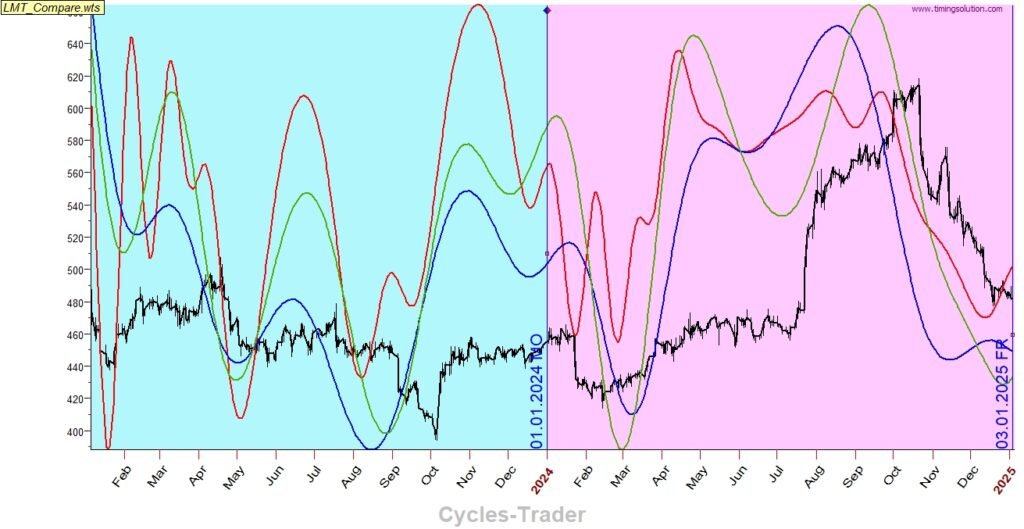
In this post we present a comparison of the existing model “G” vs the new model “U” mentioned in the last post which includes additional cycles, and a new model “120” which is a variation of the model G..
G – Blue line (weekly model) – existing model
120 – Green line (weekly model) – new model
U – Red line (weekly model) – new model
Compared stocks:
There are 27 price instruments compared, from different sectors and different price levels: SPY, COIN, NEM, LMT, ENPH, CEG, AZN, AMD, VST, ZETA, ACN, ADSK, CPAY, EQIX, EXP, FFIV, HD, MA, ORLY, PH, TRV, V, ADBE, ETH-USD, NVDA, AAPL, NIFTY-50.
Comparison period:
The comparison period is one year (from 1-1-2024 to 1-1-2025), which is far beyond what is offered as prediction, for two reasons: to enable a wider scale for comparison, and to show that the models can most accurately predict up to a year ahead.
Conclusions:
- Existing model (G) is performing well for long term predictions.
- Model 120 sometimes adds more information on top of model G.
- New Model (U) may be sometimes more accurate for the short term of few weeks.
Operatives:
The U model will be considered to added to the delivered charts of existing G model.
Since there may be more inverse cases for the U model, the U model inverse chart will also be delivered.
IN the case of adding the model U, Model G provides the general trend while model U provides some more details.
Details:
SPY

COIN
NEM
LMT
ENPH

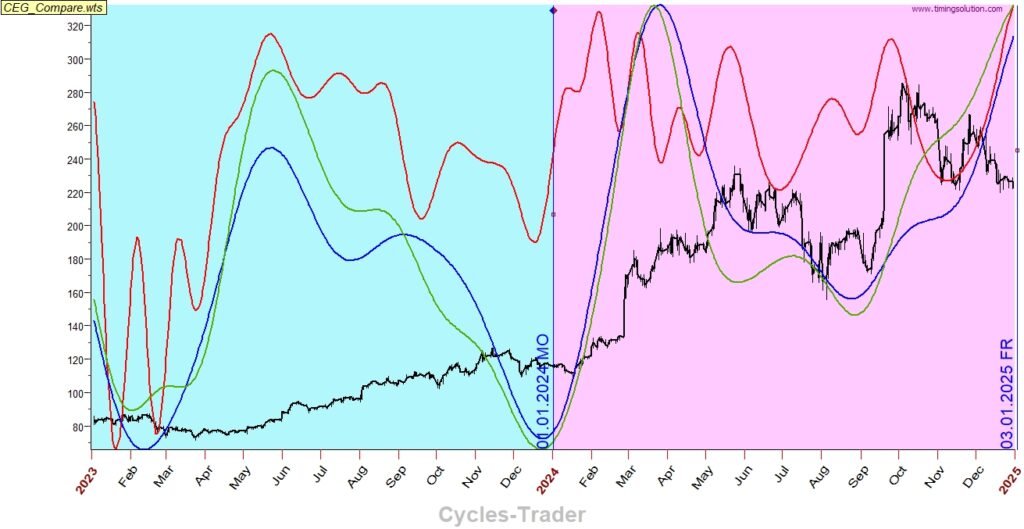
CEG
AZN

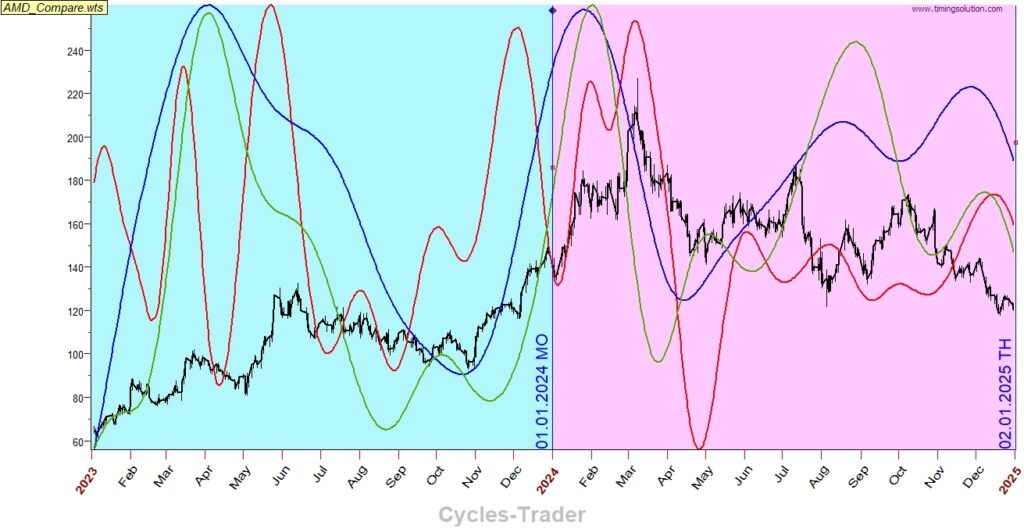
AMD
VST

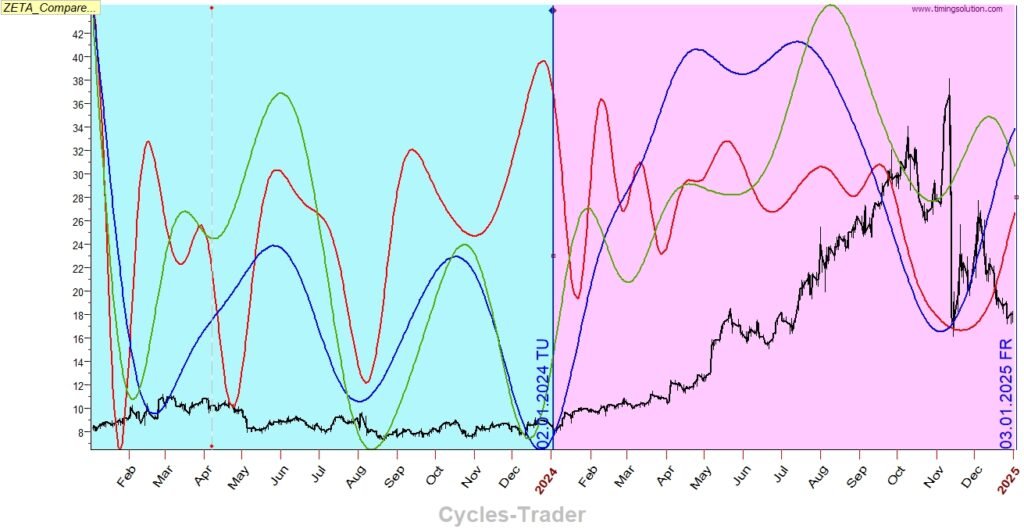
ZETA
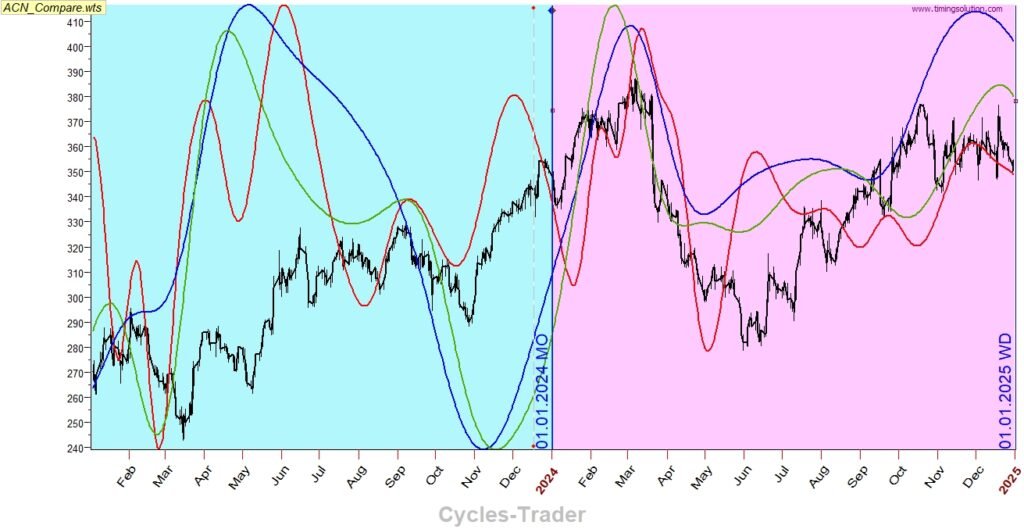
ACN
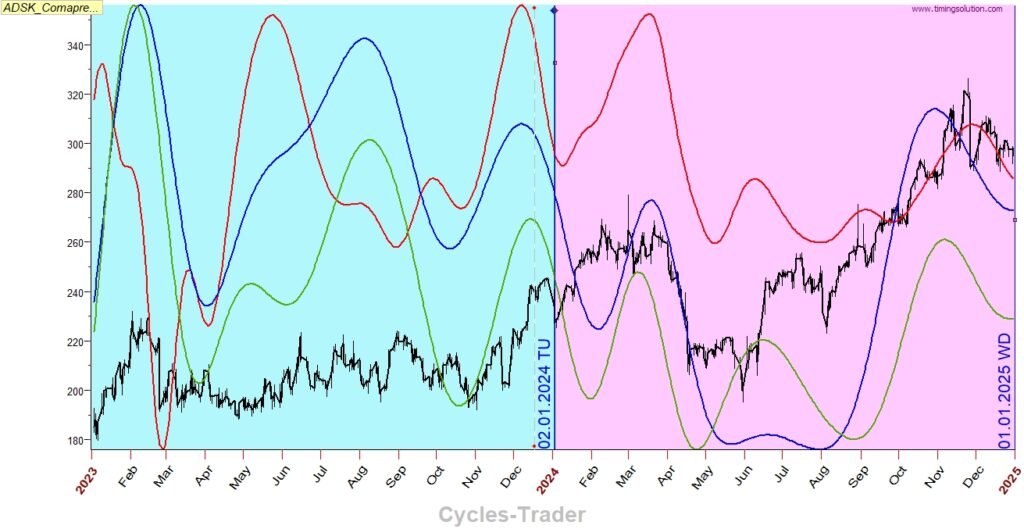
ADSK
CPAY

EQIX

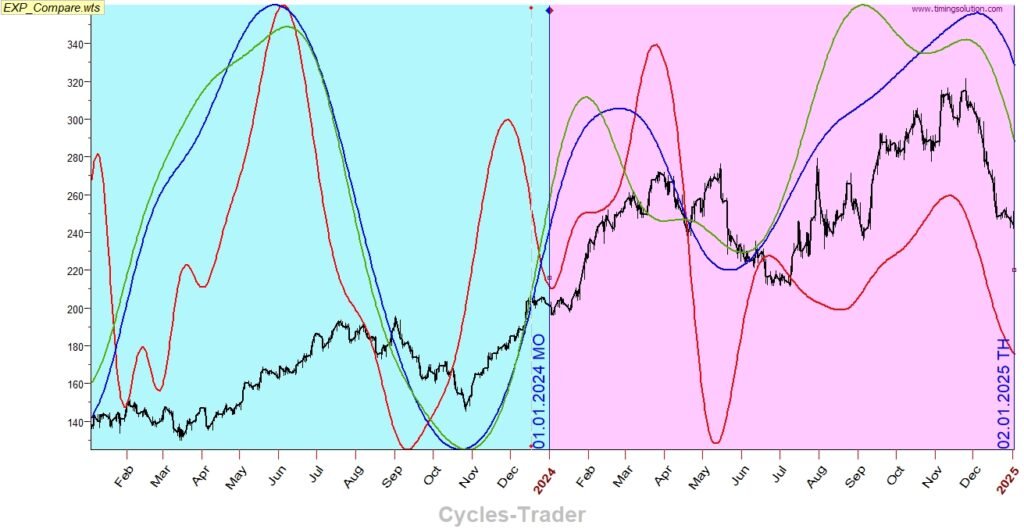
EXP
FFIV
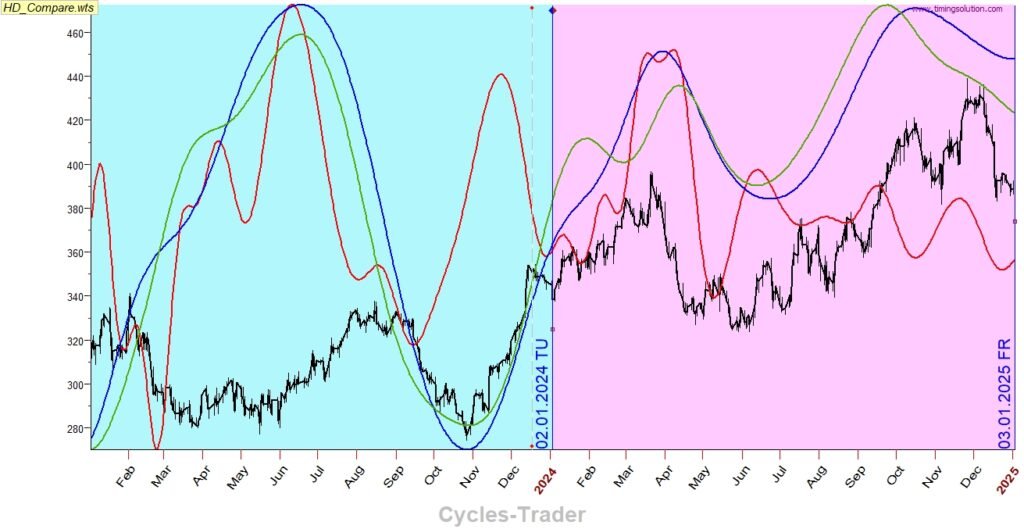
HD
MA

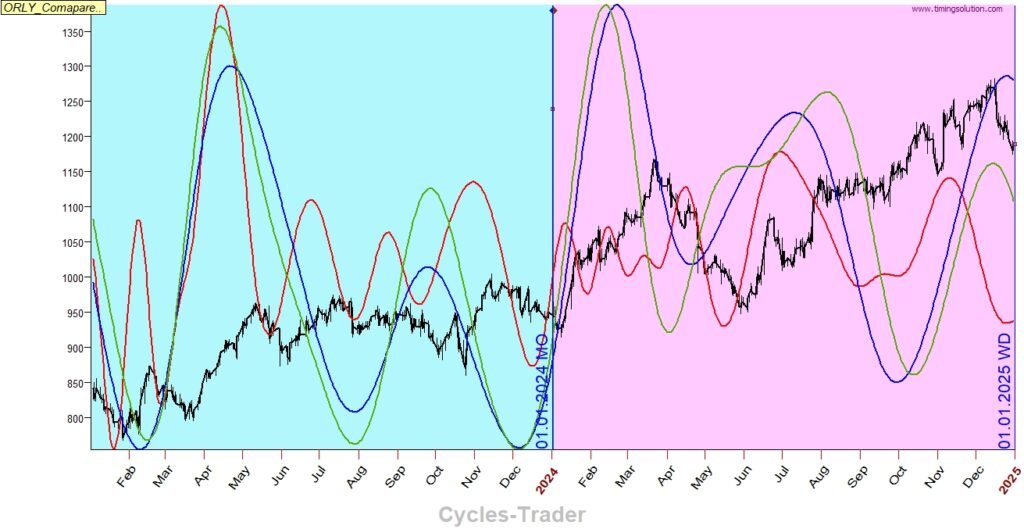
ORLY
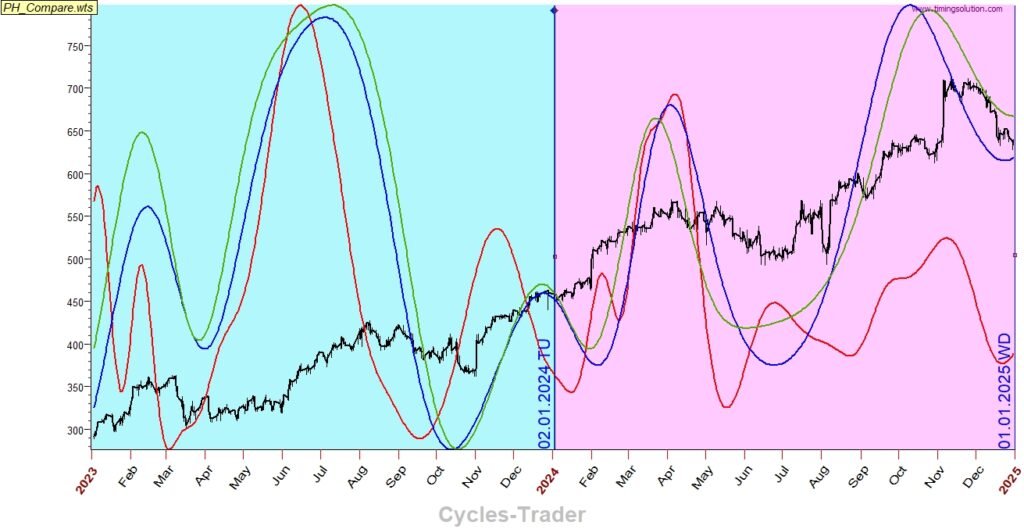
PH
TRV

V

ADBE

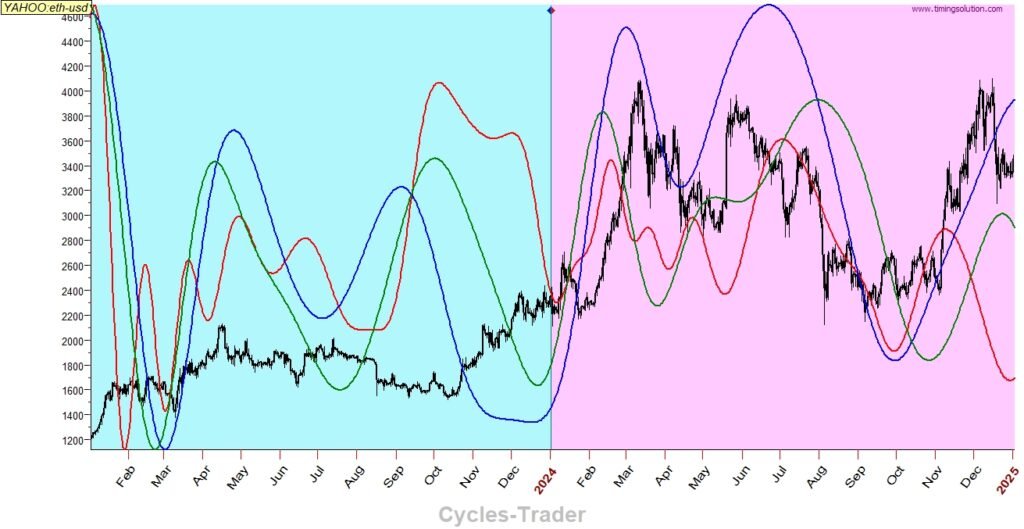
ETH-USD
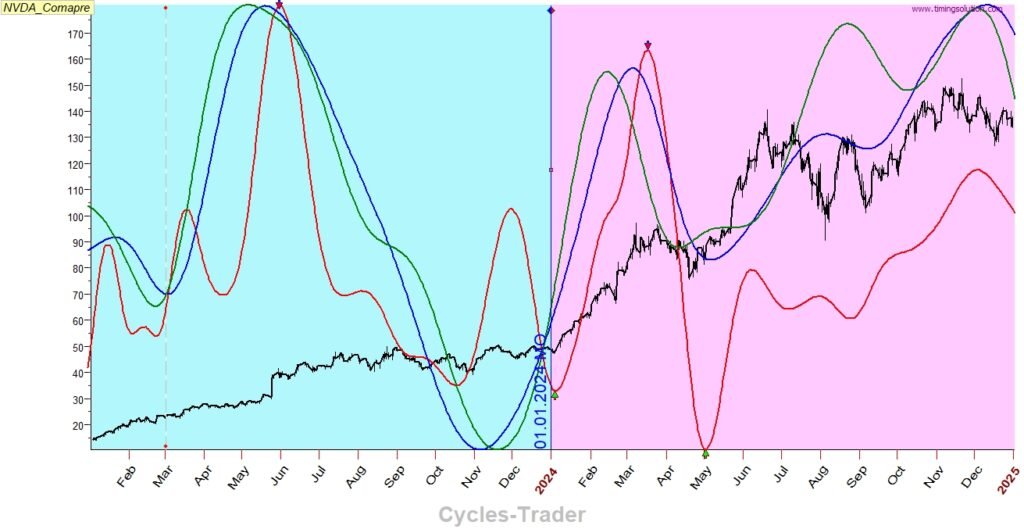
NVDA
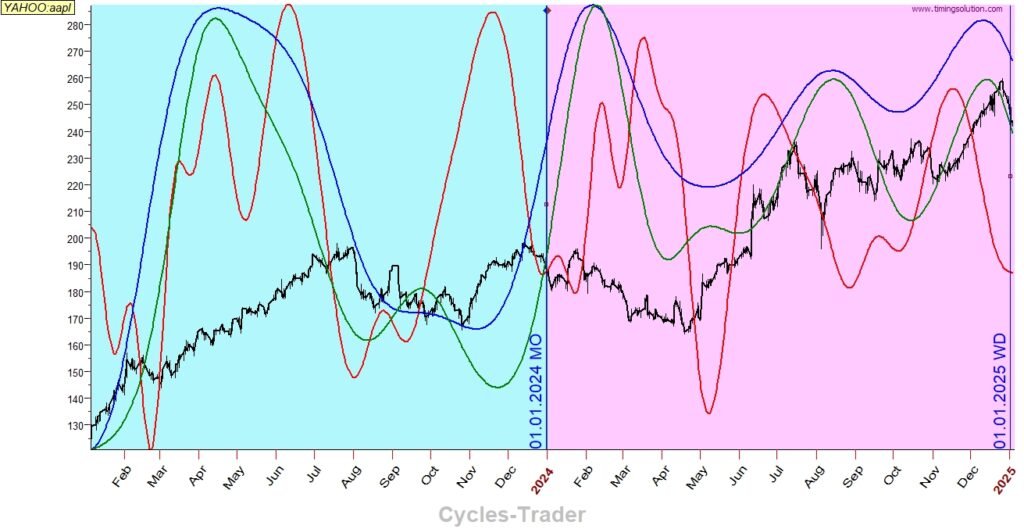
AAPL
NIFTY-50