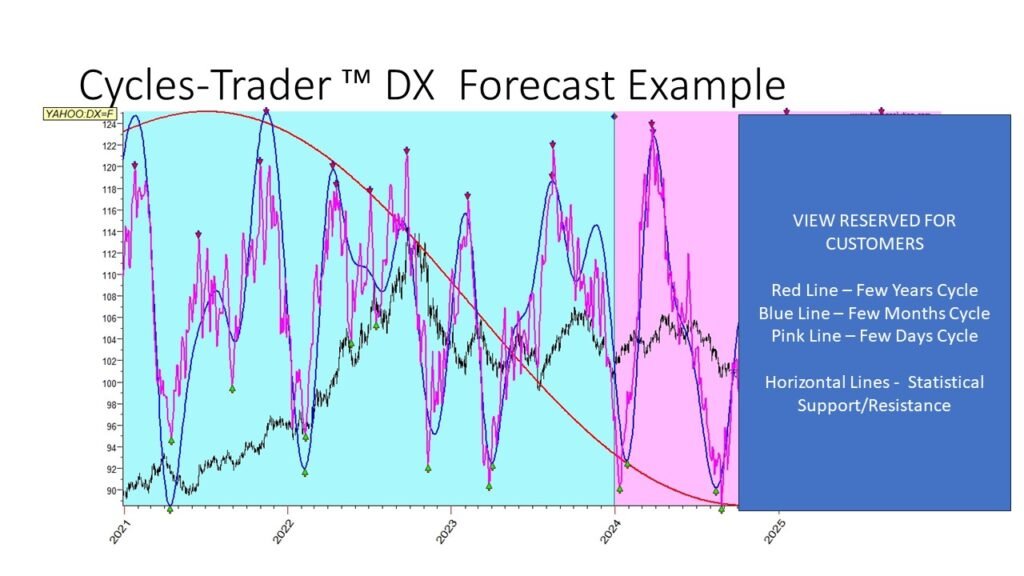
This is an example of how the forecast algorithms (AKA projection lines) performed on DX=F dollar index for the first 9 months of 2024.
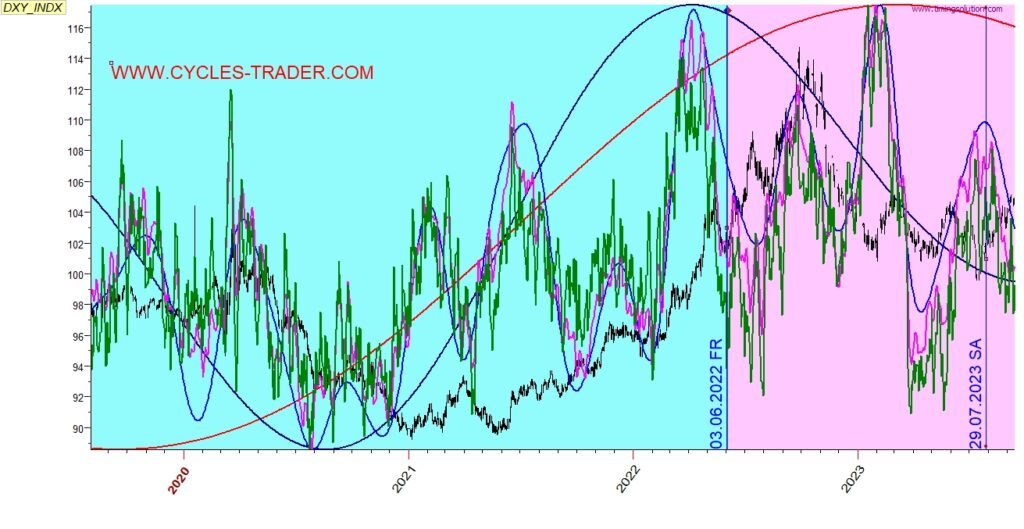
Here is a look on the historical capture of the algorithms the cycles of the price along a year, from June 2022.
The “ocean” algorithm in dark blue was added here, this is an algorithm for 1-2 years cycle.
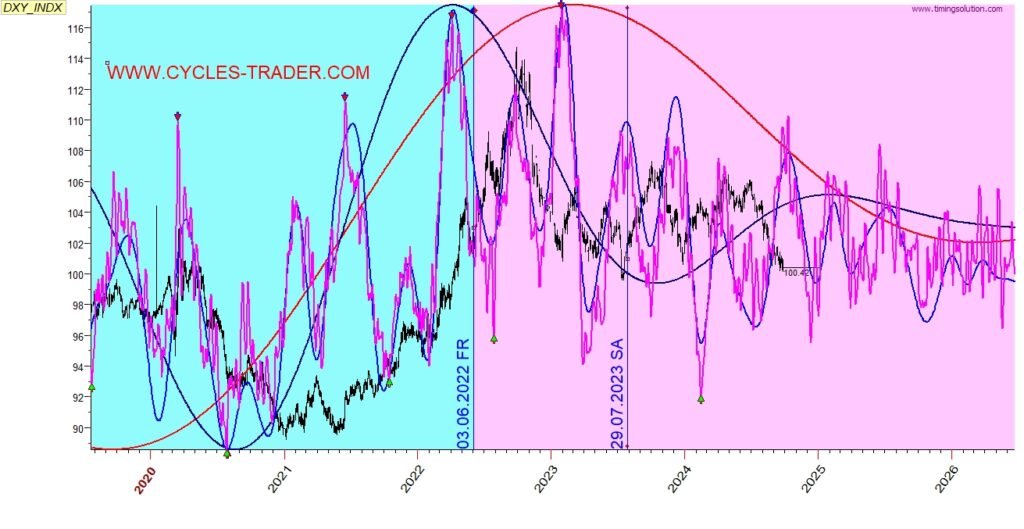
Here is a closer look with the green line added, capturing almost exactly every turn of the price.