📈 Welcome to Cycles-Trader
AI Stock Prediction & Market Timing
Stay Ahead of Market Turns with AI-Powered Cycle Forecasts. Cycles-Trader delivers AI-powered forecasts that identify market direction and turning points weeks to months ahead of time, based on 15+ years of research.
Every stock, index, or crypto asset follows cyclical movements. We decode those hidden cycles using proprietary Deep Neural Networks, verified on over 15 years of data across hundreds of instruments.
✅ Get Started – Try It Free
Curious how your favorite stock or crypto behaves?
🎯 Submit any ticker with 4+ years of price data and receive a free 6-month back-test of our forecast model.
✅ Already Tried? – Buy Now
🚀 What You Gain as a Trader:
- Know when to expect market reversals before they happen
- Plan strategic entries and exits months in advance
- Catch larger market swings
- Add clarity and timing confidence to your trading decisions
🎧 Listen to the Podcast →
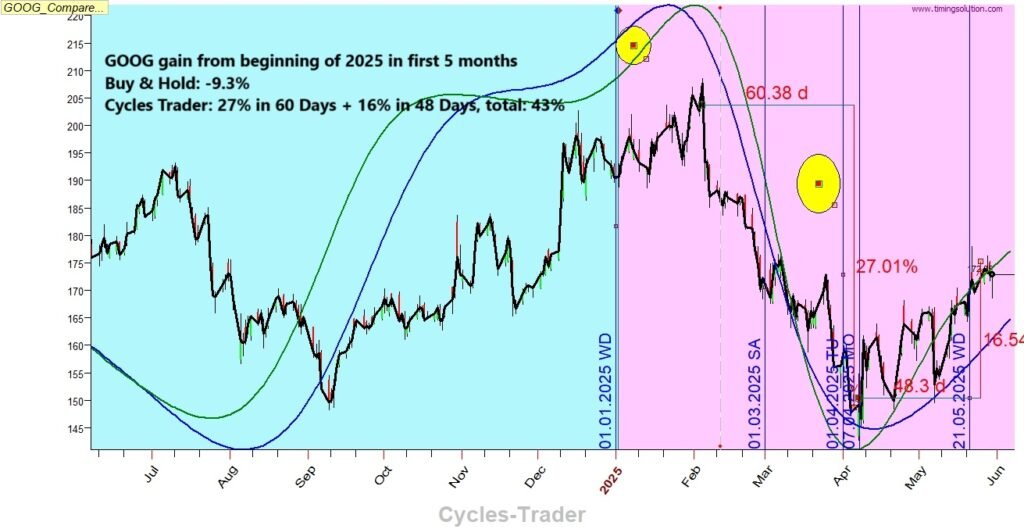
🔍 Real Example: GOOG
The chart above shows a forecast created in Jan 2025 for GOOG, verified against actual price data in June 2025. You’ll see:
- Blue shaded area: historical data used for analysis
- Pink shaded area: the forecast period (no price data known to the model)
- Blue line: mid-term (Monthly/Weekly) cycles model G
- Green line: mid-term (Monthly/Weekly) cycles model 120
- Black line: actual price (only added for verification purposes)
📌 Support/resistance levels (optional) (horizontal blue/red lines) are automatically calculated from historical data and reset after a confirmed turning point.
S&P500 Statistics: An example of a deep analysis of the S&P500 on 7 years (14 samples of 6 months) can be found here
✅ Get Started – Try It Free
Curious how your favorite stock or crypto behaves?
🎯 Submit any ticker with 4+ years of price data and receive a free 6-month backtest of our forecast model.
🔬 Supported Markets
- Stocks
- Indexes
- Crypto
- FOREX
Note: The more traded and cyclical the instrument, the better the forecast performance.
🔎 For more details about the technology, risks, and use cases, visit the About Page →
📝 For verified past forecasts, examples, and market insights, visit the Blog →